Data Analytics Course in Mumbai
Classroom • Live Online • Hybrid
Learn data cleaning, analysis with Gen AI, and visualization with hands-on projects at 3RI Technologies through our Data Analytics Course in Mumbai. Work with Python, R, SQL, Excel, Tableau, and Alteryx to turn raw data into insights and build a strong job-ready analytics portfolio.
- 4.8/5 from 4,000+ Google Reviews
- 56K+ LinkedIn followers
- Pearson VUE | GASQ | ISO Certified
You’ll get WhatsApp confirmation and email with joining link / campus details.
TRUSTED BY


Get Free Career Counseling
Talk to a counselor in 5 minutes
Having trouble? Call us at 8308103366 or Chat on WhatsApp.
Key Features
Course Duration : 5 Months
Live Projects : 4
Online Live Training
EMI Option Available
Certification & Job Assistance
24 x 7 Lifetime Support
Our Industry Expert Trainer
We are a team of 10+ Years of Industry Experienced Trainers, who conduct the training with real-time scenarios.
The Global Certified Trainers are Excellent in knowledge and highly professionals.
The Trainers follow the Project-Based Learning Method in the Interactive sessions.
Data Analyst Course in Mumbai
Looking to build a successful career in data analytics? 3RI Technologies offers a highly practical Data Analytics Course in Mumbai designed to turn beginners into industry-ready professionals. Our program is one of the top-rated data analyst courses in Mumbai, providing in-depth training in data processing, visualization, and predictive analytics using leading tools and technologies.
Whether you are starting fresh or aiming to upgrade your skills, our data analyst course in Mumbai focuses on real-world case studies and projects to help you build expertise. We also offer specialized data analytics classes in Mumbai, catering to different learning needs and schedules.
Our curriculum stands out among other data analytics courses in Mumbai, covering statistical analysis, Python for data science, SQL, Tableau, and more. We understand that affordability matters, so we maintain competitive pricing, making our data analysis courses in Mumbai accessible without compromising quality.
If you are searching for reliable data analytics courses Mumbai with strong placement support, 3RI Technologies is the right choice. Our mentors, with rich industry experience, ensure you gain practical insights and confidence to enter the workforce. Join us and take the first step toward mastering data with the best data analytics course in Mumbai.
This Data Analytics training in Mumbai is designed to help you meet the company’s expectations and exhibit your skills to be an effective data analyst. Following your completion of this Mumbai data analyst program, you will be qualified to:
- SQL principles such as SQL command and Universal Query Tool are excelled in.
- Acquire knowledge of all the concepts, including regression, dispersion, correlation, and central tendency measurements.
- Recognize the specifics of conditions and branching, objects, classes, sets, dictionaries, lists, and sets in Python.
- Utilize variables, strings, functions, loops, and conditions while writing Python code.
- Use NumPy’s multidimensional arrays to convert data, Pandas’ DataFrame manipulation tools, the SciPy library for mathematical operations, and Scikit-Learn to implement learning.
- Work with Python-based data, including reading and writing files and loading, manipulating, and storing Pandas data.
- Be familiar with a number of Python data visualization libraries, including Seaborn, Folium, and Matplotlib.
- Utilize Python libraries to do data analytics tasks.
- Demonstrate proficiency with R programming and a grasp of statement implementation.
- Demonstrate a thorough understanding of data classification techniques and regression models, both linear and nonlinear.
- Before building your own programs, make sure you comprehend R’s fundamentals completely.
- Use Excel to understand the fundamentals of business analytics.
- Apply clustering techniques including hierarchical clustering, DBSCAN, and k-means.
- Show expertise with Tableaus Desktop 10, including statistics and designing visually stunning desktops.
- Skilled in a variety of visualization techniques, including heat maps, treemaps, waterfalls, Pareto, Gantt charts, and market basket analysis.
- Experienced with Microsoft’s analytics and visualization technologies, including Power BI.
You will gain the essential data analysis skills to get your dream job as a data analyst by finishing our data analytics course in Mumbai. Various job titles include:
- Data Analyst
- Analytics Manager or Lead
- Business Intelligence Engineer
- Business Intelligence Analyst
- Business Analyst or Senior Business Analyst
- Various managerial positions
In the fast-paced digital age, Data is generated at an unprecedented rate across various industries. Forward-thinking organizations recognize the pivotal role of Data Analytics in gaining a competitive edge, enhancing operational efficiency, and fostering innovation.
At 3RI Technologies, our Data Analytics training equips individuals with the diverse skills and nuanced expertise necessary to harness the transformative potential of data, even in Guntur. Whether aspiring to become proficient Data Analysts, Business Intelligence professionals, or visionary Data Scientists, our meticulously curated program lays the groundwork for success in these pivotal roles and beyond.
Shape Your Future, Shape Your Industry: Gain a Competitive Edge with Data Expertise
In today’s data-driven landscape, organizations worldwide value Data Analytics for its profound impact. By enrolling in our training program, you’ll acquire the skills to leverage data effectively, positioning yourself for success in this thriving field. Whether pursuing a career as a Data Analyst, Business Intelligence expert, or Data Scientist, our program provides the essential foundation for excellence and advancement.
- 3RI Technologies offers data analytics training in Mumbai, lifetime access to self-paced learning, industry expert training, and real-world industry projects.
- Obtaining the 3RI Technologies Certified Data Analytics credential is the most effective way to get started in the data analytics field.
- Our curriculum will provide you with the information, assurance, and certifications you need to begin your data analysis career from scratch.
- Non-IT professionals can also enroll in 3RI Technologies’ Data Analytics Certification Courses in Mumbai.
- Learn programming in a non-traditional method that will help you develop the thought habits of a world-class developer.
Key Features
- Industry-recognized Data Analyst Master’s certificate from 3RI Technologies
- Program designed to start you off on the path to becoming a data analyst
- Enthusiastic live sessions by faculty of industry experts
- Programs are designed to be performed practically
- Trainers are remarkably experienced in their respective fields.
- Interview skills training are also provided to make students industry ready
The starting salary for a Data Analytics in India ranges from INR 3.75 LPA to 4.14 LPA. A Data Analyst’s compensation might reach INR 18 LPA depending on their experience and talents. Based on their level of experience, data analysts’ average salaries are displayed in the table below.
Years of Experience | Average Salary |
0-1 | INR 3.5 LPA |
1-2 | INR 3.8 LPA |
2-3 | INR 4.2 LPA |
3-4 | INR 4.8 LPA |
4-5 | INR 5.3 LPA |
5-6 | INR 5.7 LPA |
6-7 | INR 5.8 LPA |
Skills Required
- No Prerequisites for Data Science certification training
- Basic knowledge of SQL is advantageous
Data Analytics Course Syllabus
The detailed syllabus is designed for freshers as well as working professionals
Decade Years Legacy of Excellence | Multiple Cities | Manifold Campuses | Global Career Offers
1. Fundamentals of Data Science and Mathematical statistics
● Introduction to Data Science
● Need of Data Science
● BigData and Data Science
● Data Science and machine learning
● Data Science Life Cycle
● Data Science Platform
● Data Science Use Cases
● Skill Required for Data Science
2. Mathematics For Data Science
● Linear Algebra-Matrices
o Zero
o One
o Identify
o Diagonal
o Column
o Row
o Operations
3. Statistics for Data Science
● Structured and unstructured
● Measures of central tendency and dispersion
● Empirical Formula
● Confidence Interval
● Central Limit Theorem
4. Probability and Probability Distributions
● Probability Theory
● Conditional Probability
● Data Distribution
● Normal Distribution
● Binomial Distribution
5. Tests of Hypothesis
● Large Sample Test vs Small Sample Test
● One Sample: Testing Population Mean
● Hypothesis in One Sample z-test
● Two Sample: Testing Population Mean
● One Sample t-test – Two Sample t-test
● Chi-Square test
1. Using a Spread sheet
● What is Excel?
● Why Use Excel?
● Excel Overview
● Excel Ranges, Selection of Ranges
● Excel Fill, Fill Copies, Fill Sequences, Sequence of Dates
● Excel adds, move, and delete cells
● Excel Formulas
● Relative and Absolute References
2. Functions
● SUM
● AVERAGE
● COUNT
● MAX & MIN
● RANDBETWEEN
● TRIM
● LEN
● CONCATENATE
● TODAY & NOW
3. Advanced Functions
● Excel IF Function
● Excel If Function with Calculations
● How to use COUNT, COUNTIF, and COUNTIFS Function?
4. Data Visualization
● Excel Data Analysis – Data Visualization
● Visualizing Data with Charts
● Chart Elements and Chart Styles
● Data Labels
● Quick Layout
● An Introduction to RDBMS & SQL
● Data Retrieval with SQL
● Pattern matching with wildcards
● Basics of sorting
● Order by clause
● Aggregate functions
● Group by clause
● Having clause
● Nested queries
● Inner join
● Multi join
● Outer join
● Adding and Deleting columns
● Changing column name and Data Type
● Creating Table from existing Table
● Changing Constraints Foreign key
1. An Introduction to Python
● Why Python , its Unique Feature and where to use it?
● Python environment Setup/shell
● Python Identifiers, Keywords
2. Conditional Statement ,Loops and File Handling
● Python Data Types and Variable
● Condition and Loops in Python
● Decorators
● Python Files and Directories manipulations
3. Python Core Objects and Functions
● String/List/Dictionaries/Tuple
● Python built in function
● Python user defined functions
4. Introduction to NumPy
● Array Operations
● Arrays Functions
● Array Mathematics
o Mean
o Standard Deviation
o Max
o Min
● Array Manipulation
o Reshaping
o Resizing
● Random function
● Transpose
5. Data Manipulation with Pandas
● Data Frames
● Series
● Creating Pandas DataFrame
● Selection in DFs
● Data Describe
● Data info
● Retrieving in DFs
● Reshaping the DFs – Pivot
● Combining DFs
o Merge
o Concatenation
6. Visualization with Matplotlib
● Matplotlib Installation
● Matplotlib Basic Plots & it’ s Containers
● Matplotlib components and properties
● Scatter plots
● Histograms
● Bar Graphs
● Pie Charts
● Box Plots
7. SciPy
● Hypothesis Testing using Scipy
● Shapiro Test
● Spearmaman Test
● T-Test of Independents
● Chi-Square Test
Module 1: Introduction to Power BI
1. Introduction to Business Intelligence & Power BI
● Need for Business Intelligence
● Evolution of Power BI
● What is Power BI? Features & Components
2. Power BI Ecosystem
● Power BI Desktop
● Power BI Service
● Power BI Mobile
● Power BI Report Builder vs Paginated Reports
3. Installation & Setup
● Downloading Power BI Desktop
● Installing and configuring settings
● Exploring the start screen and workspace
4. Power BI Interface Overview
● Ribbon and Navigation Pane
● Report, Data, and Model views
● Fields Pane and Visualizations Pane
5. Supported Data Sources
● Excel, CSV, SQL Server, Web APIs
● Cloud sources: Azure, SharePoint, OneDrive
● Folder as a data source
Module 2: Data Loading and Transformation with Power Query
1. Connecting to Data
● Import vs DirectQuery
● Loading from Excel, CSV, Web, SQL Server
● Data Preview and Load options
2. Power Query Editor Overview
● Power Query UI walkthrough
● Applied Steps and Query Settings pane
● Understanding queries and query dependencies
3. Column-Level Transformations
● Split column by delimiter/position
● Merge columns
● Change data types
● Rename columns
● Add column from examples
4. Row-Level Transformations
● Filter rows based on conditions
● Remove or keep rows
● Sorting data
● Grouping data with aggregations
5. Data Cleaning & Shaping
● Handling missing values: Replace, Fill up/down
● Remove duplicates
● Pivot and Unpivot operations
● Creating conditional columns
6. Advanced Power Query Techniques
● Creating custom columns
● Using Parameters and Parameter tables
● Creating custom functions
● Merging and appending queries
● Reference vs Duplicate queries
Module 3: Data Modeling in Power BI
1. Introduction to Data Modeling
● Purpose of data modeling in BI
● Star schema vs Snowflake schema
2. Relationships in Power BI
● Creating and managing relationships
● Active vs Inactive relationships
● Cardinality (One-to-One, One-to-Many, Many-to-Many)
● Cross filter direction
Module 4: Introduction to DAX (Data Analysis Expressions)
1. DAX Basics
● What is DAX? Why DAX is powerful
● Calculated columns vs Measures
● Syntax rules and naming conventions
● Operators and precedence
● Data types supported in DAX
2. Commonly Used DAX Functions
Aggregation Functions:
● SUM, AVERAGE, MIN, MAX, COUNT,DISTINCTCOUNT
Logical Functions:
● IF, SWITCH, AND, OR, NOT
Text Functions:
● CONCATENATE, LEFT, RIGHT, SEARCH, FORMAT
Date/Time Functions:
● TODAY, NOW, YEAR, MONTH, WEEKNUM, DATEDIFF, DATEADD
Filter Functions:
● CALCULATE, FILTER, ALL, VALUES, REMOVEFILTERS
Time Intelligence Functions:
● TOTALYTD, SAMEPERIODLASTYEAR, PREVIOUSMONTH, DATESYTD
3. Advanced DAX Concepts
● Understanding Row Context vs Filter Context
● Context Transition with CALCULATE
● Iterator Functions: SUMX, AVERAGEX, MAXX, RANKX
● Optimization and performance tips for complex models
Module 5: Visualizations in Power BI
1. Core Visual Elements
● Bar/Column charts, Line charts, Pie/Donut charts
● Matrix and Table visuals
● Cards and Multi-row cards
● Maps: Shape map, Filled map
2. Slicers and Filters
● Basic Slicers
● Date and Range slicers
● Sync Slicers across pages
● Drill-down and Drill-through
3. Formatting and Interactions
● Title, label, legend customization
● Tooltips, data labels, axis formatting
● Visual interaction controls
● Custom themes and color palettes
4. Advanced Visualization
● Bookmarks and Selections Pane
● Button navigation
● Custom visuals from marketplace
● Using Python/R for visuals
Module 6: Dashboard and Report
Development
1. Report Creation
● Designing professional dashboards
● Layouts: pages, grids, sections
2. Navigation and UX
● Page navigation buttons
● Tabs, bookmarks, and interactivity
3. KPI and Gauge Visuals
● Setting up KPIs using measures
● Gauge chart design for targets
4. Filters in Depth
● Report level vs Page level vs Visual level
● Using Filter Pane and slicers
5. Performance Optimization
● Reducing visuals
● Optimizing queries and model size
● Best practices for report speed
Module 7: Power BI Service (Cloud)
1. Power BI Service Overview
● Navigating the Power BI workspace
● Publishing from Desktop to Service
2. Datasets, Reports, and Dashboards
● Difference between reports and dashboards
● Creating live dashboards in the Service
3. Collaboration & Sharing
● Sharing dashboards with users
● Workspace roles and permissions
● Power BI apps for distribution
4. Data Refresh & Gateway
● Scheduled and manual refresh
● Installing and configuring Gateway
● On-premises data connectivity
5. Row-Level Security (RLS)
● Creating roles and rules
● Testing roles in Power BI Service
1.Foundations of Artificial Intelligence
- Explore the evolution of Artificial Intelligence (AI) from the 1950s to today, covering key milestones like the Turing Test and Deep Blue.
- Understand core AI concepts: Machine Learning (ML), Deep Learning (DL), Neural Networks, Perceptrons, and Transformers (e.g., BERT, GPT).
- Learn about AI types: Narrow, General, and Superintelligent.
- Discover real-world AI applications across industries like customer service, marketing, and finance.
2. Introduction to Generative AI
- What is Generative AI
- Evolution from Traditional AI → Gen AI
- Overview of Generative AI models Large Language Models (LLMs)
- GPT, Gemini, Claude (comparison & use cases)
3. Prompt Engineering & Task Automation
- What is Prompt Engineering & why it matters
- Prompt structure: Context → Task → Output
- Prompting Techniques
- Zero-shot prompting
- Few-shot prompting
- Chain-of-Thought prompting
- ReAct prompting (Reason + Act) Role-based prompting
- Common prompt mistakes & how to fix them
- Reusable prompt templates
- Get hands-on experience using ChatGPT and Claude for task automation
Module Domain: Exploratory Data Analysis
● Case study: Admission Prediction of Graduate Admissions from an Indian
Perspective
Module Domain: Univariate and Multivariate
● Data Analysis: Case Study: Melbourne Housing, house price prediction data
set
Module Domain: Bivariate Analysis and Pandas Profiling
● Case Study: Suicide rates overview 1985 to 2016
Module Domain: Data Preprocessing: Dealing with missing values and outliers
● Case Study: Data set which deals about some cities and states. Observe the
data and see if you can recognize missing values or garbage values in the
data set and handling them. Also treating the outliers in the data set.
Module Domain: Descriptive Statistics
● Case study: Cardio Good Fitness
Module Domain: Applied Statistics
● Case Study: Leveraging customer information for making business decisions.
● Case Study: Understanding factors for Churn in a Telecom Company
Module Domain: Visualization tools
● Case Study: Sales forecast analysis
Marketing Campaign Case Study
● Airline Fare case analysis
Project Work and Case Studies Power BI
❖ Project: Retail Sales Dashboard
● Sales vs Target KPIs
● Product category and region-wise breakdown
❖ Project: HR Analytics Dashboard
● Attrition rate, hiring trends
● Department-level analysis
❖ Project: Financial Performance Report
● P & L view, trend analysis, YoY comparison
❖ Project: Supply Chain and Inventory Dashboard
● Stock availability
● Supplier performance tracking
Course Highlights

Live sessions across 6 months

Industry Projects and Case Studies

24*7 Support
Who can apply for the course?
- Aspiring Data Scientists who are interested in switching careers.
- Graduate/post-graduate students wishing to pursue their careers in Data Analytics/Data Science.
- Professionals who work with big data.
- Professionals from non-IT bkg, and want to establish in IT.
- Candidate who would like to restart their career after a gap.
- Machine learning is a topic of interest to professionals.
- Business analysts and those who work with data
Want an Expert Opinion?

Batch Schedule
Schedule Your Batch at your convenient time.
Sr. No.
Module Name
Batch Start Date
Batch Days
Timing
Enroll

Claim your free expert counseling session today!
Do you want to book a FREE Demo Session?
Project Work & Case Studies
Validate your skills and knowledge
Validate your skills and knowledge by working on industry-based projects that includes significant real-time use cases.
Gain hands-on expertize
Gain hands-on expertize in Top IT skills and become industry-ready after completing our project works and assessments.
Latest Industry Standards
Our projects are perfectly aligned with the modules given in the curriculum and they are picked up based on latest industry standards.
Get Noticed by top industries
Add some meaningful project works in your resume, get noticed by top industries and start earning huge salary lumps right away.
Our Clients


Tools to master
Skills to master
My SQL
Python
Ms Excel
NumPy
Tableau
Data Analytics
PowerBI
Supervised Learning
Supervised Learning
Big Data
R
Scipy
Data Analytics Training In Mumbai Testimonials
What our students talks about us. If you were student of 3RI and wants to share your thought about us, kindly mail or call us.
Frequently Asked Questions
In order to specialize in data science and business analytics, one must get the Data Analytics masters certification Mumbai . Additionally, gain proficiency in pertinent areas including as programming, analytics & modeling, machine learning techniques, management, business, and data visualization. After completing the training program for data analysts, you can find a respectable career.
There are many advantages to enrolling in a data analytics course in Mumbai. It gives you the fundamental abilities needed to evaluate and comprehend data, improving your employability across a range of sectors. Mumbai’s vibrant business scene offers lots of opportunity to gain practical experience. Moreover, networking with urban business people might result in job placements and career growth.
In order to assess the quality and reliability of a data analytics course in Mumbai, take into account elements like accreditation from reputable organizations, student reviews and testimonials, instructor credentials and industry experience, curriculum alignment with current industry trends, and job placement support offered. You may make an informed choice about the course’s dependability and fit for your learning objectives by researching these factors.
The following modules make up this online certification course for data analysts:
- SQL
- Excel-Based Business Analytics
- Data science with R programming
- Tableau Instruction
- Master’s Capstone in Data Analysis
- Python Programming Fundamentals and Data Analytics
- PowerBI
Many professionals are interested to master Data Analytics, but they are unsure about where to start. To assist applicants understand everything from scratch, 3RI Technologies has addressed this challenge. Therefore, it will be simple for beginners to understand the course material from the start.
This data analytics course in Mumbai is beneficial for both people who know how to program and others who don’t. However, having a basic understanding of programming languages like R, Java, SQL, or Python is recommended.
Many tools are used in data analysis. Tableau and other business intelligence technologies are used by some data analysts. Some could utilize computer languages such as Python or SQL, which come with built-in statistical and visualization tools.
Data analytics may help people and organizations make sense of data. Data analysts frequently look at raw data to identify trends and insights. Organizations use a range of tools and tactics to help them make decisions and flourish.
If you’ve never worked in data analysis before, research in a data analytics job openings worldwide. You may be able to find employment as a data analytics specialist if you have some past experience and transferable analytical skills.
- Data Analyst
- Business Intelligence Analyst
- Data Analyst Consultant
- Operations Analyst
- Quantitative Analyst
- Marketing Analyst
- Data Engineer
- Data Scientist
- IT Systems Analyst
- Project Manager
When learning data analytics, it would be helpful to have technical abilities such data analysis, statistical knowledge, data narrative, communication, and problem-solving. Additionally seen as essential abilities are business intuition and strategic thinking for data analysts who regularly work with business stakeholders.
3RI Technologies offers many video lessons from real-world industry projects, industry experts’ training, lifetime access to self-paced study, and instructor-led instruction.
The data analytics tools and technologies in a Mumbai data analyst course usually center on gathering, cleaning, analyzing, and visualizing data. Students may work on projects including utilizing programs like Excel, Python, or R, producing data reports, investigating real-world datasets, and honing their SQL querying abilities. The goal of the activities is to provide students with practical experience in data analysis so they can make informed business decisions.
To stay informed about the most recent advancements in data analytics course in Mumbai, you can take part in online forums and communities, read industry blogs, subscribe to publications about data, attend data-focused workshops and events, and consider joining neighborhood professional networking groups. By taking part in these events, you will be able to keep informed about advances and network with other professionals in the field.
In order to capitalize on the increasing demand for data analytics jobs, the 3RI Technologies Data Analyst course is an excellent means of gaining advanced data analysis abilities, including techniques for data visualization, blending, and extraction.
Data Analytics Information
- What Is Artificial Intelligence And Its Applications?
- Top Essential Data Engineer Skills in 2023
- What is Database- Types, Example, Advantages, Disadvantages
- Data Analyst Salary in India For Freshers and Experienced in 2024
- Python Tutorial for Beginners in 2023
- The Top 10 Most in-demand Tech Jobs for 2024
- 5 tips to crack interview in Data Visualisation
- 5 mistakes to avoid in 2024 for Data Analyst
- Data Science Tutorial for Beginners in 2023
- What Is Data Science With Example
- Top 10 Most in-demand Data Science Certifications
- How to become Data Scientist?
- Top 80 Data Science Interview Questions and Answers
- What Is Data Analytics: Skills, Career, Jobs, and Salary
- Top 50 Data Analyst Interview Questions And Answers
- Difference Between Data Analytics, Data Analysis, Data Mining, Data Science, Machine Learning, And Big Data
- Data Scientist Salary in India
- Machine Learning Engineer Salary In India
- Why Data Science is Important in Business
- What is NLP(Natural Language Processing)?
- The Role of NLP in Data Science
- Best Technologies To Learn In IT Industry 2020
- Is AI going to replace you?
- What is a Data Engineer? Skills, Career, Job, and Salary
- Start Upskilling Yourself in 5 Latest Trending Technologies in this Diwali 2023
- What Is A Data Analyst? How To Become A Data Analyst?
- 5 Advantages in Data Analytics for a non-IT fresher
- 5 habits of a Successful Data Scientist
- Top 25 Applications of Data Science
- Challenges in The Data Analyst Field As A Fresher
- Data Analyst vs Data Scientist
- Data Analytics Vs Business Analytics
- Resume of Data Scientist
- What is the difference between data science and AI?
- Data Science Vs Machine Learning
- What is Machine Learning? Definition, Types, Applications, and Trends
- What is a Neural Network?
- What is Sklearn in Python?
- Data Analytics For Marketing
- Data Science For Marketing
- Be The Trending Data Scientist With The Best Data Science Course In Pune
- Top 10 Job Oriented Courses After Graduation
- Trending Software Courses For 2023
- What Is ChatGPT Used For?
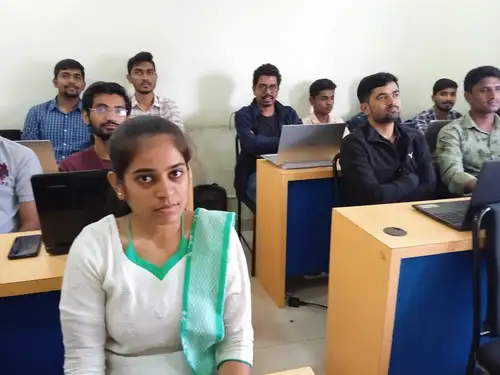
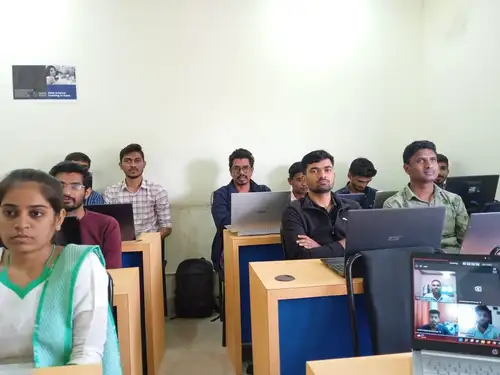
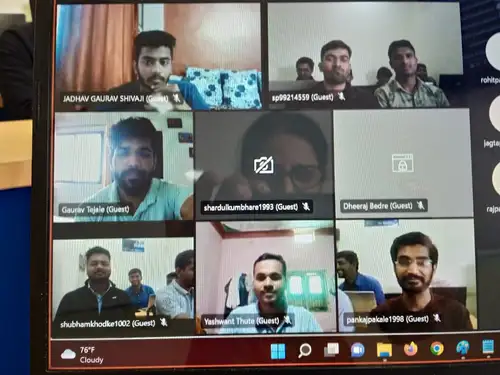
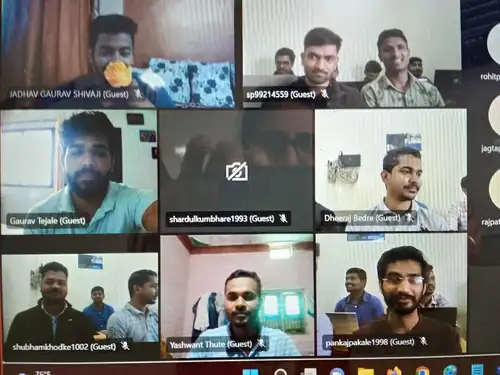
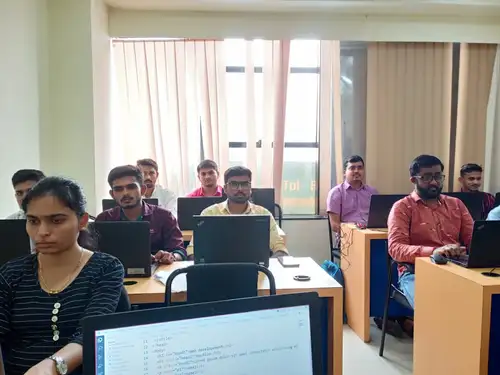
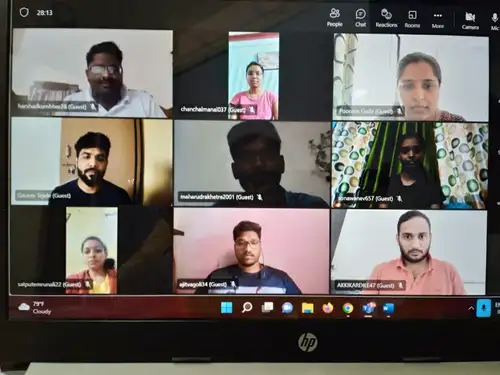
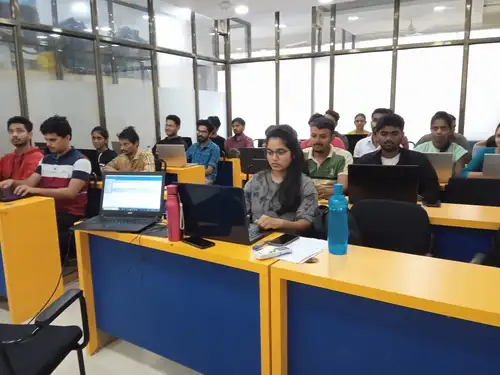
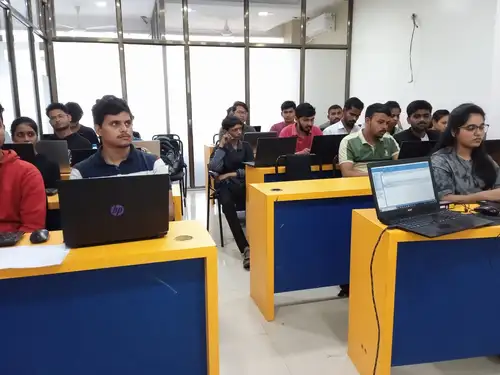
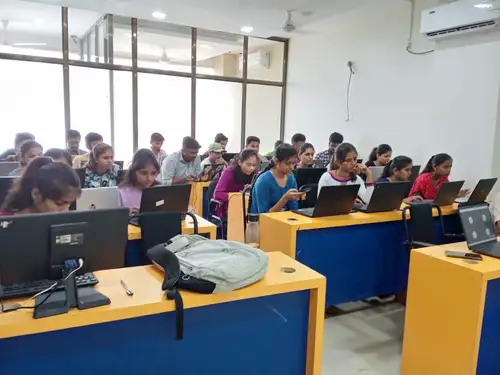
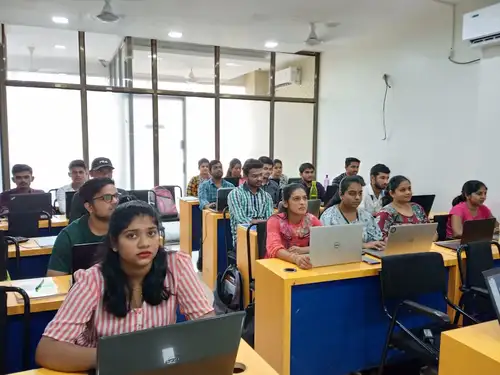
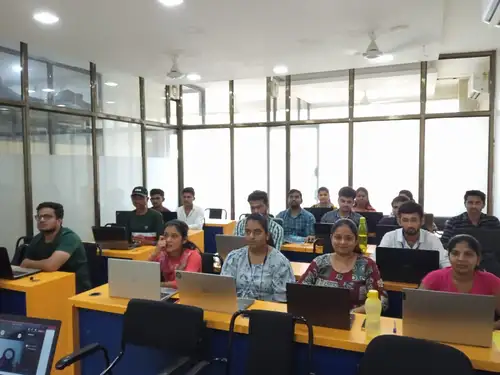
Our Gallery