
Time Series Forecasting and Perform Advanced Analytics in Power BI
In this blog article, we will learn how to get the forecasting results in Power BI by using Times series and What if Parameters forecasting graphs.

Time Series Forecasting and Perform Advanced Analytics in Power BI
In this blog article, we will learn how to get the forecasting results in Power BI by using Times series and What if Parameters forecasting graphs.
Power BI has a full-blown visualizer but it is more challenging to use or understand. Data Studio doesn't have built-in support for clustering and segmentation, which are core skills in data mining. Power BI supports these, making creating and sharing visualizations easier across websites and platforms.
Excel is part of office 365 and was introduced in 1985, and it upgrades regularly. The recent version of excel is 2018. It was virtual at that time for everyone. Everyone uses excel in their life, whether they are not experts in the data or not working in data analytics. It has a spreadsheet that divides the data into rows and columns and helps calculate using mathematics formulas easily and quickly.
Power BI vs Tableau: Which Business Intelligence Tool Should You Learn?
Everything is brilliant in this new world, so everyone needs clever work for their business. So, power bi and Tableau are both used for business intelligence. They are both used for visualizing, storing, and collecting the different data types in the easy. Both are excellent tools for business intelligence.
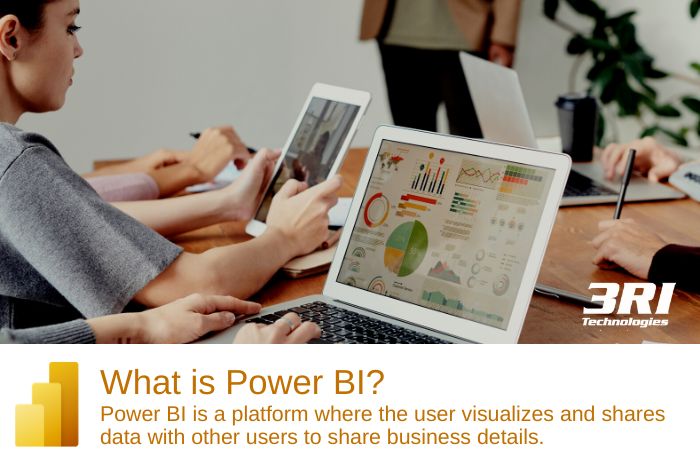
What is Power BI? Your Introduction to Data-Driven Decisions
The free edition of Power BI Desktop and Power Q&A is available for reports and dashboards. In contrast, Power BI Pro includes Power BI Service, which enables real-time report sharing, Power View, and Power BI Apps, which are very helpful while working on Power BI projects.